By Evan Hinchliffe, Head of Distribution, HOPE Housing Fund Management Limited
Overview
Strong tailwinds for the Australian residential property market – high population growth, high urbanisation / low densification, new build approvals rates, and capital growth – will enable the kind of growth we have seen over the last 30+ years to continue.
It’s important to note that these drivers play out at an aggregate level and that this is no guarantee that an investor will acquire an individual high performing asset. So, just blindly investing into residential property without using these drivers to influence where, when and how you buy won’t necessarily secure you the best return.
Importantly, models are now emerging that enable investors to access this key asset class via a scaled funds management model, in a way similar to what has occurred in many other alternative asset classes – providing investors with an innovative structure for accessing the largest asset class in the market.
Australian housing market overview
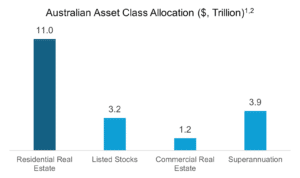
Before we investigate the drivers of housing price growth in Australia, it’s important to understand the scale of the housing market (as an asset class). As of October 2024, the value of residential property totalled $11.0 trillion.[1]
[1] CoreLogic, Monthly Housing Chart Pack, October 2024
If we compare residential real estate with other well-known asset classes and sectors, we can see that it is approximately:
- 5 times as big as the ASX
- 9 times the Commercial Real Estate asset class; and
- 8 times as large as the superannuation sector.2
The fact is residential real estate is systemically important to the Australian economy – 70% of Australia’s household wealth is tied to property and many of Australia’s banks rely on mortgages as their main source of business.[2] According to CoreLogic research, Australia’s median dwelling value has increased 6.8% over the 30 years to 2022. Can this growth continue, and if so, what are the key drivers?
Long term drivers of residential property growth
There is a lot of commentary on what shapes the housing market in Australia – much politically motivated, or short-term in nature.
Individually, we all tune into the RBA rate announcements and pour over the Governor’s post rate announcement to divine where the RBA might move rates next. Many pundits have argued that the relative level of interest rates drive (or dampen) Australian residential house prices. However, the chart below highlights there is little evidence of this.[3]
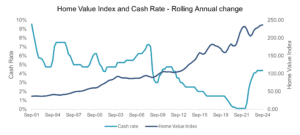
Having just lived through the experiment of rising interest rates, we can safely put to rest the idea that the two are correlated.
From our research, we will present four key macroeconomic factors or “megatrends” that drive long term growth in Australian residential property.
These trends are some of the things that fund managers (as professional property investors) are thinking about, and something that you can be discussing with your clients as well.
The four key drivers are – (i) high population growth, (ii) high urbanisation / low densification, (iii) rate of new build approvals, (iv) capital vs. yield, and we’ll unpack each of these in this article.
High population growth
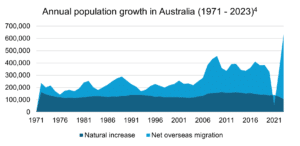
High population growth, driven by migration, has been the norm in Australia for decades. The average population growth rate for the 20 years to 2022 in Australia was 1.4%. In a global context, population growth rates in Australia are much higher than most developed countries. For example, in the same 20-year period – New Zealand grew at 1.1%, the US grew at 0.9% and the UK at 0.4%.
In recent years, the Australian population growth rate has hit fresh highs, driven by net overseas migration. Based on Federal Budget forecasts – that net overseas migration will be halved from 528,000 in 2022–23 to 260,000 in 2024-25, with a reduction to 255,000 in 2025–26. That said, these forecast numbers, will still be above the 10-year average in the period prior to Covid, as can be seen in the chart below.
High urbanisation combined with low densification
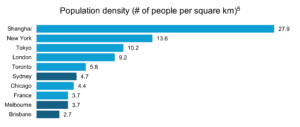
Australia’s population is unusually concentrated, with most Australians living in a small number of large cities. People are attracted to urban centres and are willing to pay more to be near to jobs and amenities.
Eastern seaboard capital cities (Sydney, Melbourne and Brisbane) contain the majority of the Australian population. As of the 2021 census, 50% of the Australian population lives in these three cities, and according to forecasts, over the next 30 years the proportion of Australia’s population in these cities is expected to further increase to 57%.
This level of urbanisation contrasts sharply with the UK, where the same 50% is spread over nine cities and the US where the number is 37 cities.
Further, Australia is not just a country of largely coastal hugging towns. Within Australian population centres, people are spread over a larger geographical space than global peers. The chart below highlights the comparatively low density.
New build approvals
While we have labelled the third driver – ‘New Build Approvals’, what we have seen is that dwelling approvals don’t always equate to dwelling completions – as can be seen in the gap between the orange and blue lines in the chart below.
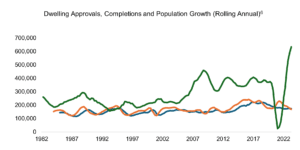
To add to this, there had been a multi-decade decline in the average number of people living in an individual home. From 2.8 in the mid-1980s to 2.5 today, which has the effect of creating extra demand for dwellings.
Capital growth vs. rental yield
The key point to note here is – Australia’s residential property market is characterised by high capital growth, and low rental yields. Specifically, the gross yield in key eastern seaboard cities, according to CoreLogic, as of October 2023 are:
- 0% in Sydney
- 4% in Melbourne
- 0% in Brisbane
Conversely, Australia has some of the highest capital growth rates among global peers. And the core issue here is that Australian rental yields have not kept up with the increases in property value.
Nationally, average gross house rental yields have fallen from 4.0% in 2012 to 3.5% in June 2022 and unit rental yields have fallen from 4.6% to 4.1% during the same period.
Accessing residential property growth at scale
A new fund management model now provides investors with access to the residential real estate market at scale, allowing them to lever an investment to these growth drivers and share in property appreciation based on their equity stake in a diverse residential property portfolio, without the hassles of the traditional landlord model.
This market evolution of co-investment funds now enables investors who have a strong affinity for property but have experienced sub optimal net returns to be part of the home ownership solution, whilst generating attractive returns.
[1] CoreLogic, Monthly Housing Chart Pack, October 2024
[2] https://www.abc.net.au/news/2024-05-09/ian-verrender-mortgage-brokers-eating-bank-profits/103821972
[3] Source: CoreLogic Hedonic Home Value Index (2009 = baseline year, where index =100) | RBA
[4] ABS, Annualised rates to June quarter
[5] https://luminocity3d.org/WorldPopDen/#8/51.880/4.883
[6] ABS
The information in this article was finalised in November 2024. This article has been prepared by HOPE Housing Fund Management Limited (HOPE) ACN 629 589 939 (Investment Manager/Manager/Company/HOPE/HOPE Housing) for general information purposes only, without taking into account your personal objectives, financial situation or needs.


