By Maroun Younes, Fidelity International
One of the characteristics investors love about new economy stocks, such as those found in the technology and communication services sectors, is that they are generally ‘capital-light’. That is, they require relatively less upfront investment to get the businesses started and growing attractively over time.
Consider Google. Google opened its first office in Menlo Park with just US$1m, raised from family, friends, and a few angel investors such as Andy Bechtolsheim and Jeff Bezos. Not to be outdone, Facebook launched with a mere investment of US$2,000, half from Mark Zuckerberg and half from Eduardo Saverin. Over the ten years from 2000, Microsoft grew its net profits by almost US$14b, whilst spending just under US$32b on capital expenditure (capex) and acquisitions. That equates to a return on investment of 43%, which is extremely lucrative.
By contrast, consider more capital-intensive businesses. A new cement manufacturing plant may cost hundreds of millions of dollars to establish, and it could cost into the tens of billions of dollars to replicate the Emirates Airways fleet of planes.
Over the years, Warren Buffett has spoken at length about the advantages of capital-light businesses he’s invested in, such as See’s Candies, and how some of the most attractive businesses in the world can grow with minimal re-investment requirements. See’s Candies may be a great business, but it needs next to no capital to grow its business, which puts a ceiling on its attractiveness, albeit a high one. If you earn attractive rates of return on incremental investment, being able to reinvest back into the business is preferable to not.
Thinking back to Microsoft, with returns in excess of 40% over the 2000 decade, shareholders have been rewarded by the US$32b it put to work on capex and acquisitions over this period. Of course, the rewards would have been even greater if they’d been able to deploy more capital at those same rates of return.
This brings us to one of my favourite Warren Buffett quotes, which was in his 1992 letter to Berkshire shareholders, “the best business to own is one that over an extended period, can employ large amounts of incremental capital at very high rates of return.”
Too much of a good thing?
So, if you can earn attractive rates of return on reinvestment opportunities, how much should you invest back into the business? Invest too little, and you may forgo opportunities to unlock additional shareholder value. Invest too much, and you run the risk of investing in projects that are too marginal and take too long to pay back.
There is, at least in this context, too much of a good thing. So how much is too much? In theory, as long as returns which are generated exceed the cost of capital, then additional shareholder value is created by continuing to reinvest. In practice however, it’s often too hard to know what the threshold is until you’ve already crossed it.
Back in the late 1990s, telco and cable companies were in a race to lay as much fibre as possible because the opportunities expected to be brought about by the internet seemed limitless. This behaviour can create enormous supply gluts when taken to extreme, and this certainly happened during the ‘dotcom’ boom. When the dust settled after the bubble burst, it was estimated in 2002 that only 2.7% of the fibre network was being used in the USA[1].
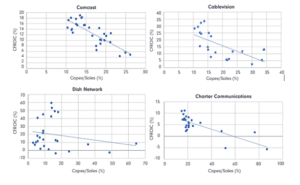
Generally speaking, there is an inverse relationship between capital intensity (as measured by the capex/sales ratio) and return on investment. This was true for cable companies at the turn of the millennium, as shown by the following charts. You can see that for these leading cable companies in the US at the time, return on investment declined as the companies invested more heavily.

Source: FactSet, FIL
A closer look at the Magnificent Seven
This brings us to the current mania surrounding artificial intelligence (AI), which I believe has parallels with the dotcom boom. Like the internet, AI is expected to change our lives in profound ways, and like fibre investment (which was the conduit for the internet), we seemingly can’t get enough spend on semiconductor chips, data centres, and computational models, which are the conduits for AI.
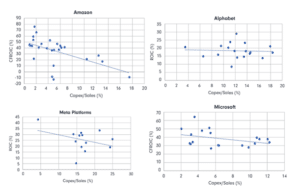
You could be tempted to think that the current big AI spenders are very different to their cable predecessors, and whilst they are in some ways, in others they are not. Today’s generation can also experience an inverse relationship between capex spend and return on investment. You can see in some familiar names from the Magnificent Seven that returns on investment trend down when companies invest too heavily.

Source: FactSet, FIL
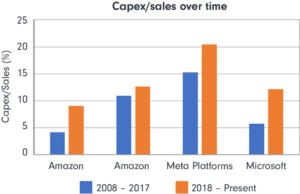
This finally brings us around to look at the substantial growth in capex spend that we’re seeing from the likes of Amazon, Alphabet, Meta, and Microsoft.

Source: FactSet, FIL
It’s clear that these businesses today are very different beasts to what they were a decade ago. From a capital intensity standpoint, Amazon and Microsoft are now twice as capital hungry as they once were. All four tech behemoths are building their own and/or taking up significant space in third party data centres. Microsoft even recently announced a deal with Constellation Energy to re-start the shuttered nuclear power plant at Three Mile Island in Pennsylvania and buy all its electrical output for the next 20 years.
The numbers look even more striking when viewed in US dollar terms. Collectively, these businesses spent US$23b in 2014 on capex. That number in 2024 is around US$210b, with forecasts for these figures to grow by ~8% p.a. for the next two years (i.e. exceeding US$250b in 2026). The growth in earnings required to maintain existing rates of return for these businesses will be in the hundreds of billions over the next few years.
The other thing to be cognizant of is the accounting treatment of capex. Capital expenditures are spent in real time and hit the cash flow statement in the fiscal year they are spent. However, their impact on the accounting profits is delayed. Capex is depreciated and amortised over a much longer period, usually anywhere from a couple of years to multiple decades, depending on what the funds are spent on.
For example, whilst Amazon, Alphabet, Meta, and Microsoft are on track to spend over US$210b on capex in 2024, their depreciation and amortisation (D&A) expense is likely to be around half that, reflecting the much smaller capex figures deployed in years gone by. This means that their D&A expense will climb up sharply over the next decade or so, most likely outpacing the growth in capex. This will represent a substantial headwind to earnings per share growth over the next few years, unless the AI investments start reaping rewards very soon. All the while, this cohort continue to trade at elevated valuation multiples. This is not to say that these stocks can’t continue to perform commendably over the next few years, it’s just that the investment proposition today is very different to what it was a decade ago, and in my opinion, far less attractive.
If the returns on investment made by these businesses do not meet their budgeted expectations, this not only creates earnings risk for the stocks in question, but it also too could create the risk that they start to moderate the level of investment. This would have flow on impacts to suppliers such as chip makers, data centre providers, electrical utilities etc.
Time will ultimately give us the answer to this, but for now, it is worth keeping a close eye on.
Important information
All information is current as at 5 November 2024 unless otherwise stated.
This document is issued by FIL Responsible Entity (Australia) Limited ABN 33 148 059 009, AFSL No. 409340 (‘Fidelity Australia’). Fidelity Australia is a member of the FIL Limited group of companies commonly known as Fidelity International. Prior to making any investment decision, investors should consider seeking independent legal, taxation, financial or other relevant professional advice.
© 2024 FIL Responsible Entity (Australia) Limited. Fidelity, Fidelity International and the Fidelity International logo and F symbol are trademarks of FIL Limited.
[1] Dreazen, Yochi, “Wildly Optimistic Data Drove Telecoms to Build Fiber Glut”, Wall Street Journal, 26th September 2002


